Performance monitoring
The starting point for a performance analysis is the objects tab in the admin panel.
There you will find system information about the hosts (ioBroker is multi-host capable) and the individual adapters.
They only become visible in expert mode: this is switched via the icon in the bottom left of the menu bar. Then enter system.host.<Name des Hosts>. in the ID filter:
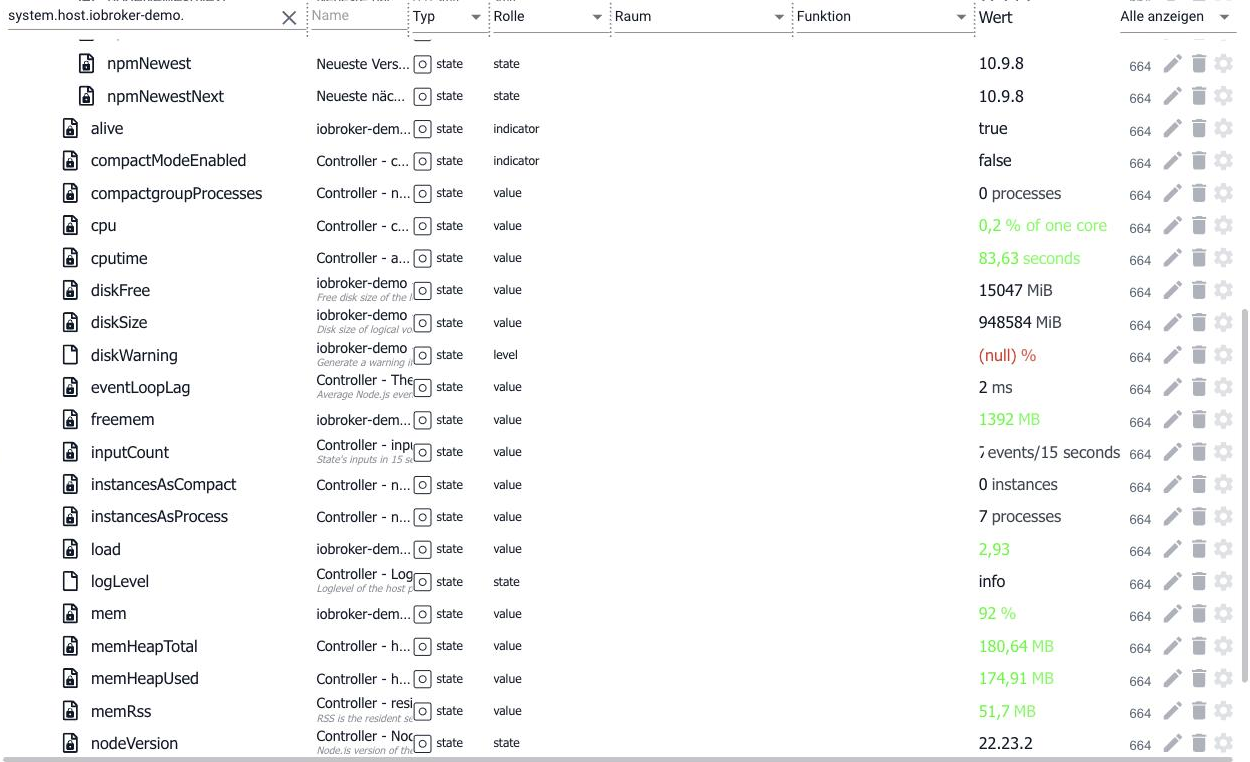
Host performance metrics
In ioBroker terminology, a host is a computer running an ioBroker js controller process.
In a multi-host environment, this can easily involve multiple computers to distribute the load.
Even the operating systems used can differ.
This presents a neat challenge for Raspberry Pi cluster stacks, for example, to manage their 1GB RAM hardware limit.
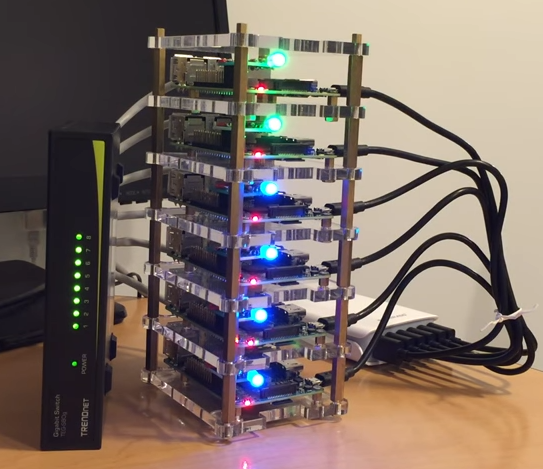
The ioBroker JS controller coordinates the starting and stopping of the adapters and performs other system management tasks in the background. Performance values for each host computer and the JS controller can be found in the admin panel under the ID system.host.<Name_des_Hostrechners>.
Here is a list of the individual key figures and their meaning:
| Key figure | Data type | Unit | Description |
|---|---|---|---|
| alive | Logic | none | Indicates whether the ioBroker js-controller is active on the host |
| diskFree | Number | MiB | Free disk space on the logical drive where ioBroker is installed bi = binary multiple (1 MB = 1,000,000 bytes) < (1 MiB = 1,048,576 bytes = 1 × 1024 × 1024 bytes) |
| diskSize | Number | MiB | Total size of the logical disk on which ioBroker is installed |
| diskWarning | Number | % | You can enter a percentage value here. A warning will be displayed in the admin panel if the free space on the disk falls below this value (e.g., 20). This is especially useful if the History adapter is active. 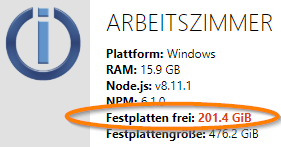 |
| freemem | Number | MB | Total available RAM system memory of the host |
| inputCount | Number | /15s | Number of changes to the state values. An input event can be triggered, for example, by creating or setting a value. |
| load | Number | % | Total system CPU load, averaged over one second. Don't be surprised, this value is always 0 under Windows. |
| mem | Number | % | Memory usage. Ratio between free memory and total system memory |
| memHeapTotal | Number | MB | Size of the heap memory reserved by the JS controller |
| memHeapUsed | Number | MB | Size of the heap memory used by the JS controller |
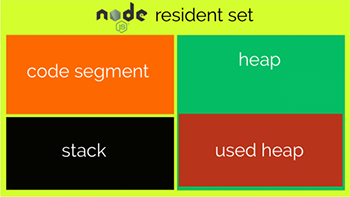
| memRss | Number | MB | Resident Set, total size of the memory used by the JS controller in RAM |
| outputCount | Number | /15s | Output events include actions such as value comparison, writing a value to the states database, events due to subscriptions, or logging from an adapter to obtain information about .connected or .alive states, for example. This is also how the 8 events typically appear in the instance list under the event output value are generated. |
| uptime | Number | s | Runtime of ioBroker on this host since the last restart |
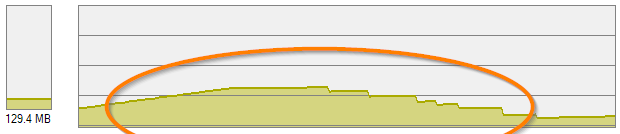
The following diagram symbolically shows how the heap, code, and stack contribute to the total memory usage memRss of a nodejs process:
If the master JS controller itself provides the object and state database for the entire system, this metric clearly illustrates the difference in memory consumption between 300 and 3000 ioBroker objects. For example, on my Windows system, this value fluctuates between 75 and 128 MB with 3500 objects and 2700 states. This is thanks to the integrated garbage collection in Node.js.
However, if I use Redis as the state database, the memory consumption for the JS controller drops to 50 MB.
(Now Redis needs an additional 25 MB = back to 75 MB ;))
If the number of state changes exceeds the processing capacity of dependent event consumers (e.g., JavaScript with on: triggers), a queue builds up in the in-memory databases.
This can be observed in the memory usage of the JavaScript controller. As soon as the system load decreases and the event consumers are given sufficient time to process the pending value changes, the value of memRss reverts to its original value.
As is so often the case in this field, fixed values alone cannot provide precise information about the cause of errors.
However, what often helps is observing a flawlessly functioning system (=reference values) and then comparing the same system under error conditions. Additionally, it is very useful to record one or more data points in the history to, for example, identify trends and outliers.
Performance values of adapters
Each adapter has its own performance metrics.
They are stored under the ID system.adapter.<Name_des_Adapters>.<Instanz> and differ slightly from those of the host.
| Key figure | Data type | Unit | Description |
|---|---|---|---|
| alive | Logic | none | Indicates whether the adapter is active |
| connected | Logic | none | Indicates whether the adapter has responded within the last 30 seconds |
| inputCount | Number | /15s | Number of changes to the state values. An input event can be triggered, for example, by creating or setting a value. |
| memHeapTotal | Number | MB | Size of the heap memory reserved by the adapter |
| memHeapUsed | Number | MB | Size of the heap memory used by the adapter |
| memRss | Number | MB | Resident Set, total size of the memory used by the adapter in RAM |
| inputCount | Number | /15s | Number of changes to state values. An input event can be triggered, for example, by creating or setting a value. |
| outputCount | Number | /15s | Output events include actions such as value comparison, writing a value to the states database, events due to subscriptions, or logging from an adapter to obtain information about .connected or .alive states, for example. This is also how the 8 events typically appear in the instance list under the event output value are generated. |
| uptime | Number | s | Adapter runtime since adapter start |
For example, if the Javascript adapter suddenly jumps from 100 inputCount events to several thousand after a script change, there is a strong suspicion that a trigger loop, i.e. a ring reference, has been built into the script.
It is also useful to examine memRss to detect, for example, memory leaks caused by scripts or in adapters. alive and connected can be used to nicely visualize the adapter's status in vis, or to suppress the display of incorrect data if the adapter cannot provide new values.
Outlook and Question
Here's a picture as a glimpse into the future (and into my development environment):
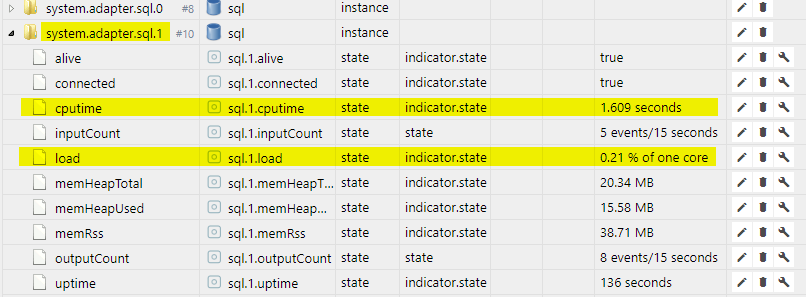
The adapters lack a display showing the CPU load caused by each individual adapter (cpu).
After all, one wants to know which system is currently culprit without installing resource-intensive additional monitoring adapters. Since Node.js is single-threaded, the display here refers to a single CPU core. It can't go above 100%.
Even using CPUs with multiple cores won't help if an adapter is constantly showing high values.
Only a faster CPU (commonly referred to as a higher clock speed), optimized program code, or distributing the load across multiple adapters (if possible) will solve the problem in this case.
The cputime metric allows you to evaluate the total processor time used by the adapter since startup.
It provides information about the frequency or intensity (keyword: computationally intensive) with which a program utilizes the processor.
This total is almost always lower than the adapter's total uptime (uptime), because even with intensive use, the adapter rarely sends instructions to the processor continuously.
Here you can clearly see how the different key performance indicators interact and what the reaction of the Javascript adapter to a sudden surge of requests looks like in Flot:
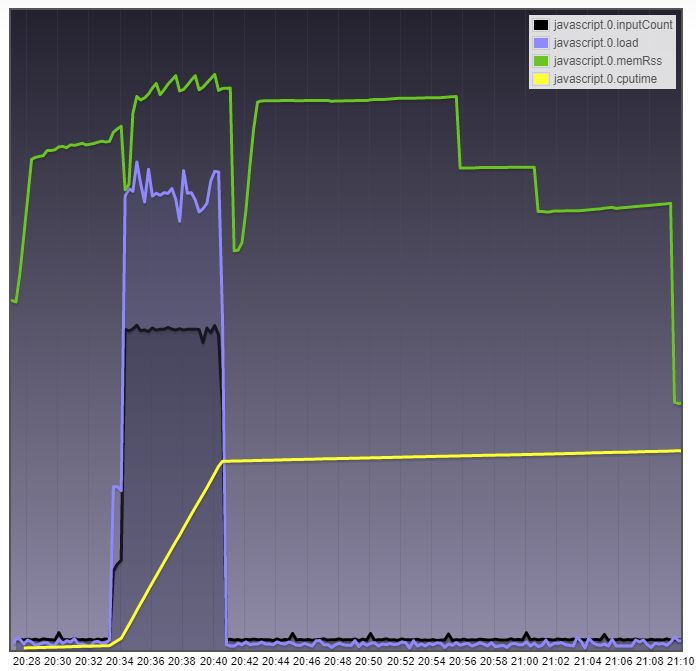
Incidentally, the JavaScript adapter was already so overloaded that it could no longer accept all events immediately.
An event queue formed.
To learn more about the load on the host, and specifically on the master of all adapters, the js-controller, I have also included some performance counters for it. The following list shows a possible future appearance of the host performance counters.
As mentioned, this is subject to review by Bluefox and will only apply from js-Controller 1.5.x onwards:
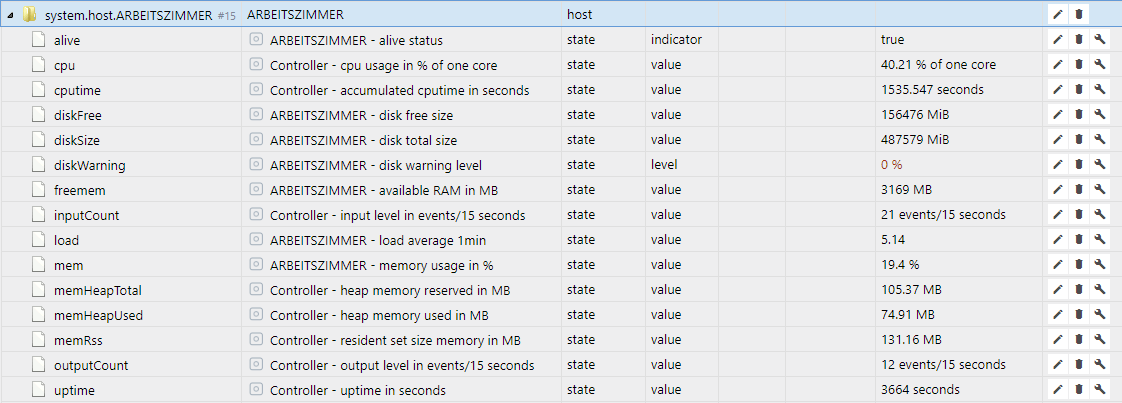
In summary, the meaning of the data points is as follows:
| Key figure | Data type | Unit | Data source | Description |
|---|---|---|---|---|
| alive | Logic | none | js-controller | Indicates whether the ioBroker js-controller is active on the host. Automatically switches to false 25 seconds after it stops working. |
| cpu | Number | % Core Utilization | js-controller | Indicates the utilization of the core on which the js-controller is running. It can't go much higher than 100% because nodejs is single-threaded. |
| cputime | Number | s | js-controller | The processor time (CPU time) refers to the measured time in seconds that the js-controller has actually sent commands to the processor since the last program start. This total is almost always lower than the total runtime (uptime) of the program, since even with intensive use, it rarely sends instructions to the processor continuously. |
| diskFree | Number | MiB | Free disk space on the logical drive where ioBroker is installed bi = binary multiple (1 MB = 1,000,000 bytes) < (1 MiB = 1,048,576 bytes = 1 × 1024 × 1024 bytes) | |
| diskSize | Number | MiB | Total size of the logical disk on which ioBroker is installed | |
| diskWarning | Number | % | You can enter a percentage value here. A warning will be displayed in the admin panel if the free space on the disk falls below this value (e.g., 20). This is especially useful if the History adapter is active. 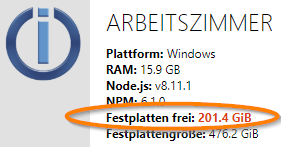 | |
| freemem | Number | MB | Total available RAM system memory of the host | |
| inputCount | Number | /15s | js-controller | Number of changes to the state values. An input event can be triggered, for example, by creating or setting a value. |
| load | Number | Total system load across all CPU cores, averaged over one second. E.g., computer with 8 CPU cores -> value 7.9 = system almost overloaded, 0.1 = nothing happening; 4 cores -> value 3.9 = overload - if persistent, 0.1 = nothing happening | ||
| mem | Number | % | Memory usage. Ratio between free memory and total system memory | |
| memHeapTotal | Number | MB | js-controller | Size of the heap memory reserved by the js-controller |
| memHeapUsed | Number | MB | js-controller | Size of the heap memory used by the js-controller |
| memRss | Number | MB | js-controller | Resident Set, total size of the memory used by the js-controller in RAM |
| outputCount | Number | /15s | js-controller | Output events include actions such as value comparison, writing a value to the states database, events due to subscriptions, or logging. This is how the 10+ events are generated here as well. |
| memAvailable | Number | MB | js-controller | (Only on *nix systems) Available free memory for new memory requests without the system having to start swapping out used memory. Calculated from MemFree, Active(file), Inactive(file), SReclaimable and the lower thresholds from /proc/zoneinfo.See https://git.kernel.org |
| memAvailable | Number | MB | js-controller | (Only on *nix systems) Available free memory for new memory requests without the system having to start swapping out occupied memory. Calculated from MemFree, Active(file), Inactive(file), SReclaimable, and the lower thresholds from /proc/zoneinfo.See https://git.kernel.org |