Debugging an adapter
An adapter is a Node.js program, so it can be paused and step-by-step executed using standard tools. Node.js has a built-in debugger; you just need to access it.
Three paths, from the recommended to the last resort:
| Away | When |
|---|---|
| dev-server | During development. A separate small installation in the project folder.dev-server debug See dev-server . |
iobroker debug | If the error only occurs on a real system, with its configuration and data. |
| Start manually | If you want to precisely control how the process starts. |
The built-in path:iobroker debug
iobroker debug sayit
iobroker debug sayit.1
The command searches for the adapter, starts its main file with the Node Inspector, and attaches itself. If the instance is already running, it aborts and says: an instance cannot run twice. Therefore, before that...iobroker stop sayit.0 .
| option | Effect |
|---|---|
--wait | It stops immediately on the first line instead of allowing the adapter to complete. This is necessary if the error occurs at startup. |
--ip <adresse> | The address to which the inspector is bound. Without specifying, only...127.0.0.1 . |
--port <nummer> | The Inspector's Port, otherwise 9229. |
By hand
The same without the command:
cd /opt/iobroker
iobroker stop sayit
node --inspect node_modules/iobroker.sayit/main.js 0 --debug
Two things are important:--inspect It belongs before the main file; it's an option of Node.js itself. And the adapter needs its instance number and--debug as his own arguments, otherwise he tries to log in to the controller.
--inspect-brk instead of--inspect It stops on the first line.
Connect with Chrome
Chrome includes a built-in debugger. In the address bar:
chrome://inspect
The running adapter appears under Remote Target ; clicking inspect opens the developer tools. This displays breakpoints and their conditions.watch The call stack, variable view and console are available, so everything you know from debugging in the browser.
If ioBroker is running on a different computer, its address must be entered once under Configure , using the same port as at startup.
Using Visual Studio Code
Open the adapter folder and in.vscode/launch.json Create two configurations:
{
    "version": "0.2.0",
    "configurations": [
        {
            "type": "node",
            "request": "launch",
            "name": "Adapter starten",
            "program": "${workspaceFolder}/main.js",
            "args": ["0", "--debug"]
        },
        {
            "type": "node",
            "request": "attach",
            "name": "An laufenden Adapter anhängen",
            "address": "127.0.0.1",
            "port": 9229
        }
    ]
}
Starting the adapter executes the adapter from within VS Code. The instance must be stopped for this to work.iobroker stop <name>.0 ).
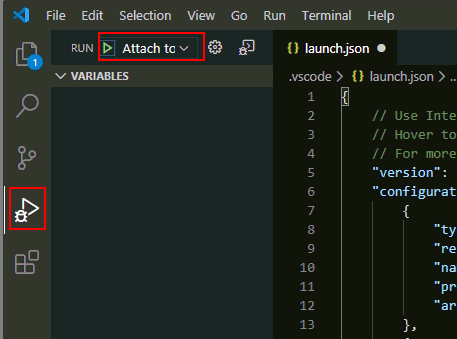
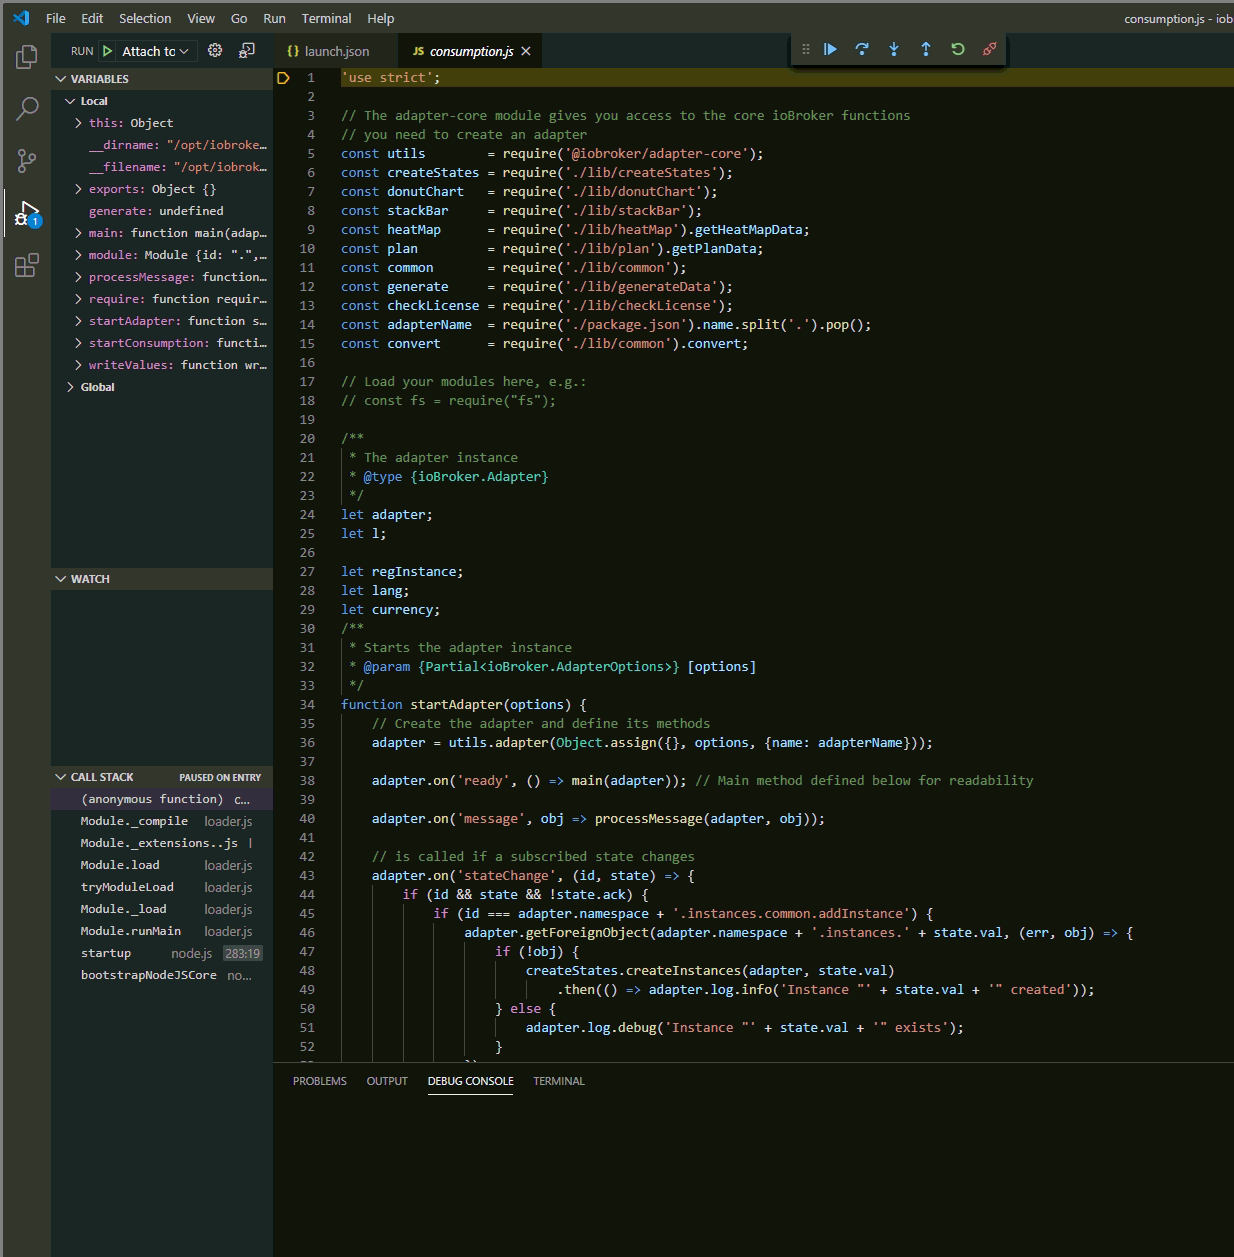
Attaching to a running adapter connects to an adapter that is already connected.--inspect It also works on another computer. Then the IP address of the ioBroker computer is displayed there instead.127.0.0.1 .
With WebStorm
WebStorm requires a Node.js execution configuration. Instructions for setting it up can be found under WebStorm .
Debugging over the network
In order for another computer to connect, the inspector must listen on an reachable address:
node --inspect-brk=0.0.0.0:9229 node_modules/iobroker.sayit/main.js 0 --debug
The Inspector is not a debug interface, but an open door. Anyone who connects to it can execute arbitrary code on the computer. There is no login and no password.0.0.0.0 Therefore, it should only be used on a trusted network, never forwarded to a router, and the adapter should be restarted normally afterward. Anyone who needs to use an unsecured network should forward the port via SSH.ssh -L 9229:127.0.0.1:9229 benutzer@iobroker-rechner Then the inspector remains on the target computer.127.0.0.1 bound.